
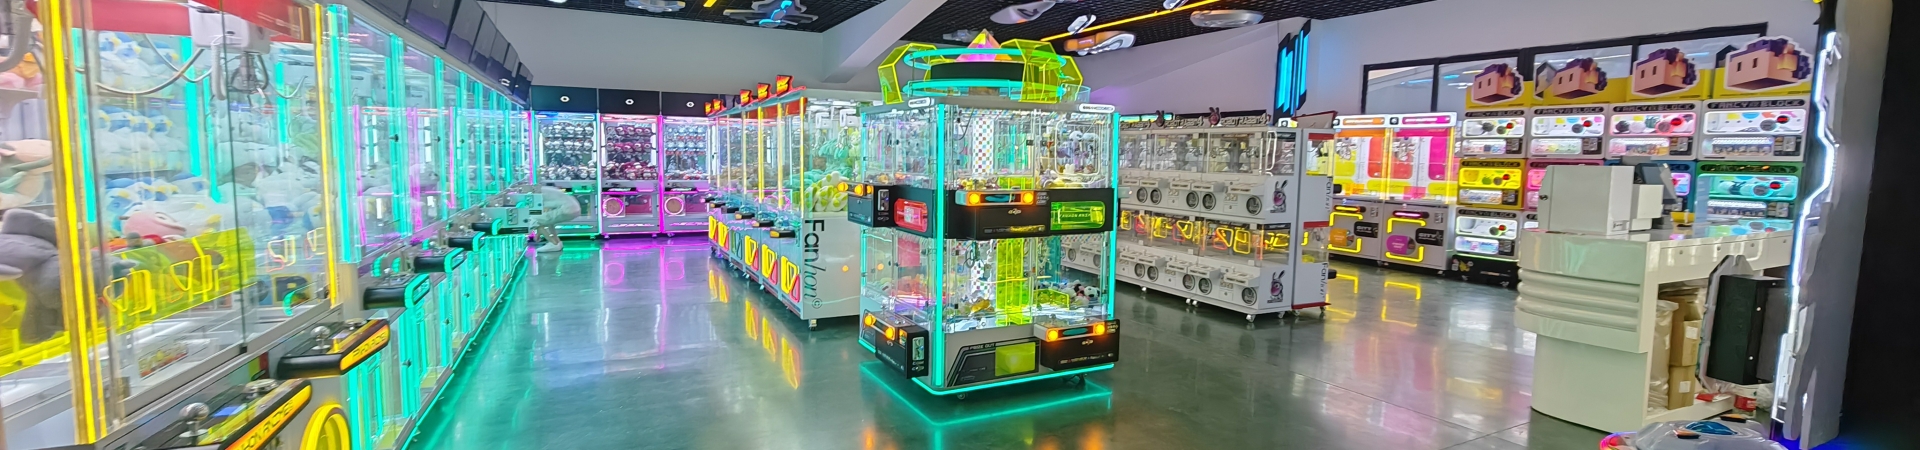
Overview
Both claw machines and traditional vending machines are established categories within the unattended retail and amusement industry, and both are frequently evaluated by small business operators seeking semi-passive income opportunities. While they share surface-level similarities—coin/card-operated, placed in third-party venues, requiring periodic servicing—their economics, revenue models, and operational demands differ in meaningful ways. This comparison draws on available industry data to help prospective operators make an informed decision.
Revenue Models Compared
Vending machines (snacks, beverages, and combo units) generate revenue through product sales at marked-up retail prices. The industry is mature and well-documented. According to the National Automatic Merchandising Association (NAMA) and IBISWorld, the U.S. vending machine operators industry (NAICS 45421) generated approximately $9–$10 billion in annual revenue as of 2023–2024. The average vending machine in a decent location generates $200–$800 per month in gross revenue, with top-performing machines in high-traffic office buildings or transit hubs exceeding $1,000–$2,000.
Claw machines generate revenue through per-play charges, typically $1–$2 per play, with the cost of the "product" (prizes) being substantially lower per unit than vending machine inventory. As noted in previous articles, a well-placed claw machine generates $400–$2,000 per month gross. While the revenue ranges overlap significantly, the margin structures differ.
Margin Comparison
The critical difference lies in cost-of-goods-sold (COGS). For a vending machine, the COGS—the wholesale cost of the snacks, drinks, or other products—typically represents 40%–55% of retail sale price. A $2.00 bottle of water may cost the operator $0.60–$0.90 wholesale; a $1.50 bag of chips may cost $0.70–$0.90. This leaves a gross margin of roughly 45%–60% before location costs and other expenses.
For a claw machine, COGS (prize costs) typically represent only 20%–30% of revenue when properly managed, yielding a gross margin of 70%–80% before location and other costs. This significantly higher gross margin is the primary financial advantage of claw machines.
Net profit margins after all costs also tend to favor claw machines. Vending operators commonly report net margins of 10%–25%, while claw machine operators in comparable placements typically report 15%–35%. However, vending machines can generate higher absolute revenue in high-demand locations (busy office buildings, hospitals, universities), which may result in higher absolute profit per machine despite lower margins.
Operational Complexity
Vending machines require more frequent servicing due to product perishability (expiration dates for food/beverages), higher restocking frequency (a busy vending machine may need restocking every 3–7 days), and more diverse inventory management (tracking multiple SKUs, managing planograms, and responding to consumer preferences). A claw machine typically needs restocking every 1–4 weeks and has minimal perishability concerns.
However, claw machines require more specialized technical maintenance—claw calibration, win-rate programming, and mechanical component servicing—while vending machines, though mechanically complex, have a more mature service infrastructure with widely available repair technicians.
Upfront Investment
A new commercial vending machine (combo snack/drink unit) typically costs $3,000–$8,000, with refurbished units available for $1,500–$3,500. A new commercial claw machine ranges from $2,000–$7,000 for quality brands, with used units available for $500–$2,000. For budget-conscious operators, claw machines offer a lower entry point.
Market Saturation and Competition
The vending industry is significantly more mature and saturated. NAMA data indicates approximately 5 million vending machines in the U.S. as of recent estimates. Competition for prime vending locations—office buildings, schools, hospitals—is intense, and many venues already have established relationships with large vending operators like Canteen, Aramark, or Compass Group. Claw machines face less competition for location placement because they occupy a different niche (entertainment/amusement rather than convenience food service), and many venue managers welcome them as complementary rather than competitive.
Risk Profile
Vending machines carry product waste risk (expired inventory) and are sensitive to shifts in consumer health and dietary preferences. Claw machines carry minimal inventory waste risk (plush toys don't expire) but are more sensitive to location foot traffic and consumer discretionary spending. During economic downturns, entertainment spending (including claw plays) may decline more sharply than snack/beverage purchases.
Frequently Asked Questions
Can I operate both claw machines and vending machines together? Yes, and many route operators do. A blended portfolio reduces risk through revenue diversification. Some operators place a claw machine alongside a vending machine in the same venue, increasing per-location revenue and leveraging a single collection trip.
Which is easier to finance or lease? Vending machines have a more established leasing and financing ecosystem due to the industry's maturity. Companies like VendSoft, Perka, and various equipment financing providers offer vending-specific programs. Claw machine financing is available but less standardized; many operators self-fund or use general equipment financing.
Which has better long-term growth potential? The claw machine and broader amusement machine segment has been growing faster on a percentage basis than the traditional vending industry, driven by experiential entertainment trends, social media shareability, and expansion into non-traditional venues. However, vending continues to evolve with smart vending technology, micro-market concepts, and healthy product offerings. Both segments have viable long-term trajectories.
References
NAMA (National Automatic Merchandising Association). "State of the Vending Industry Report." 2024. https://www.namanow.org/
IBISWorld. "Vending Machine Operators in the US." NAICS 45421. 2024.
IBISWorld. "Amusement Machine Operators in the US." NAICS 71312. 2024.
Vending Market Watch. "Annual State of the Industry Report." https://www.vendingmarketwatch.com/
Grand View Research. "Vending Machine Market Size Report." 2024.